Maps
Bakken maps
Where we buy, what recent lease sales paid in each county, where the latest BLM sale parcels are, and where the rigs are running. All drawn from public data, with the sources under each map.
Last updated:
Interactive map
The interactive map needs JavaScript. The same maps are below as plain images with data tables.
One map for all five layers. Zoom and drag to look closer, and tap or hover a county or a parcel for its numbers. Everything below the map is the same data as images and tables.
Loading the map...
Scroll, pinch or use the buttons to zoom. Drag to move. Keyboard: arrow keys, plus, minus and 0.
- Core county
- Active county
- Other county
Counties we buy in, grouped as on our Bakken counties page. Boundaries: U.S. Census Bureau, cartographic boundary files (2023 counties, 1:5,000,000). Cities: U.S. Census Bureau, Gazetteer files (place points).
- Under $100
- $100 to $999
- $1,000 to $2,999
- $3,000 to $5,999
- $6,000 or more
- Not in that table
Average bonus per net acre by county at the Oct. 6 to 13, 2026 Trust Lands auction, our tally from the Land Board's county table. Source: Board of University and School Lands agenda packet, October 29, 2026 (October 2026 auction results summary). Boundaries: U.S. Census Bureau, cartographic boundary files (2023 counties, 1:5,000,000).
The Land Board's table prints $1,098 an acre for Williams County, but its own bonus and acres for that county ($3,931,927 over 2,039.84 net acres) work out to $1,928, so we show $1,928.
- Under $100
- $100 to $999
- $1,000 to $2,999
- $3,000 to $5,999
- $6,000 or more
- No parcels offered
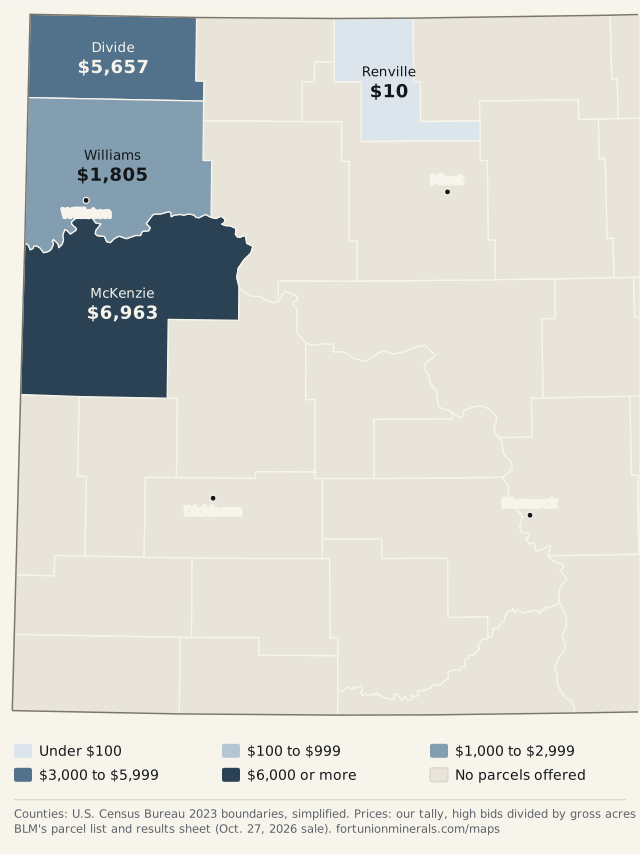
Average high bid per gross acre by county at the BLM Oct. 27, 2026 sale, our tally from the parcel list and results sheet. Source: BLM ePlanning documents page for the sale (Sale Results). Boundaries: U.S. Census Bureau, cartographic boundary files (2023 counties, 1:5,000,000).
- Under $100
- $100 to $999
- $1,000 to $2,999
- $3,000 to $5,999
- $6,000 or more
- No parcel
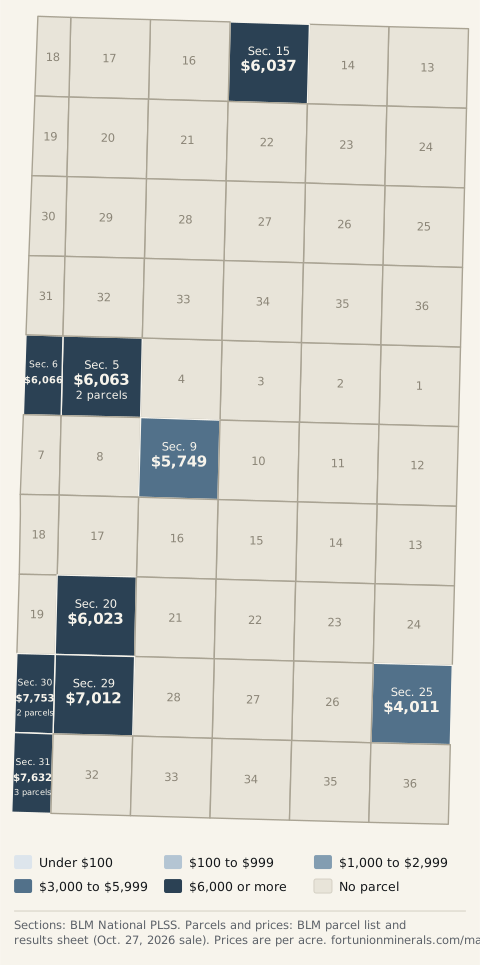
Parcels from the BLM Oct. 27, 2026 sale, each placed at the middle of its section using BLM National PLSS CadNSDI (section outlines). Prices and acres: BLM ePlanning documents page for the sale (Sale Results). Circle size grows with acres. Zoom in on a circle to see the section outlines. 1 parcel not on the map is listed in the parcel table.
- 1 to 2 rigs
- 3 to 5 rigs
- 6 to 9 rigs
- 10 or more rigs
- No rigs listed
Active drilling rigs by county, counted from the North Dakota DMR Oil and Gas Division, Active Drilling Rig List on October 27, 2026, 38 rigs in all. Boundaries: U.S. Census Bureau, cartographic boundary files (2023 counties, 1:5,000,000).
Where we buy
What it shows. The counties in western North Dakota and eastern Montana where we buy minerals and royalties. The dark counties are the ones we call core, and the lighter ones are active, where we look at tracts case by case.
How to read it. Tap or click a county that has a page of its own to read about it. The other shaded counties link to the county list on our Bakken page.
| County | State | Group |
|---|---|---|
| Richland County | Montana | Core |
| Dawson County | Montana | Active |
| Roosevelt County | Montana | Active |
| Sheridan County | Montana | Active |
| Dunn County | North Dakota | Core |
| McKenzie County | North Dakota | Core |
| Mountrail County | North Dakota | Core |
| Williams County | North Dakota | Core |
| Billings County | North Dakota | Active |
| Burke County | North Dakota | Active |
| Divide County | North Dakota | Active |
| Golden Valley County | North Dakota | Active |
| McLean County | North Dakota | Active |
| Stark County | North Dakota | Active |
What the latest lease sales paid, by county
What it shows. The average price per acre in each county at the latest state and federal oil and gas lease sales. Both maps use the same color scale, so you can compare them. North Dakota Trust Lands leases state-owned minerals, and BLM leases federal minerals.
How to read it. Each county's number is the total paid divided by the acres leased there. For Trust Lands, that is bonus divided by net mineral acres, from the Land Board's county table. For BLM, it is high bids divided by gross acres, which is our tally from the sale's parcel list and results sheet. Net and gross acres are not the same, and the two agencies offered different land, so the maps do not measure the same thing. A county's average only reflects what was offered in that sale. It is not what any other acre in the county would bring.
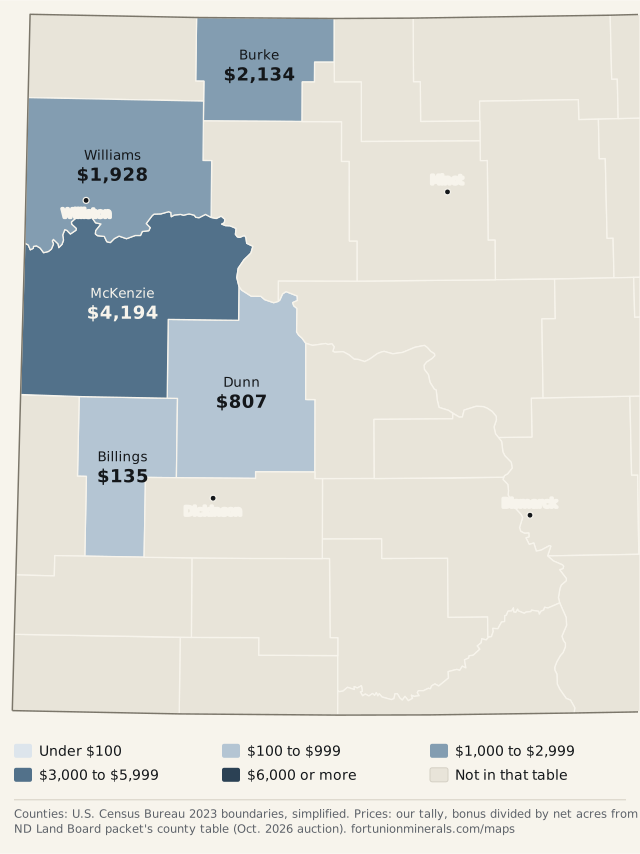
| County | Tracts | Net acres | Total bonus | Bonus per net acre |
|---|---|---|---|---|
| McKenzie | 7 | 1,120 | $4,696,960 | $4,194 |
| Burke | 9 | 419 | $894,276 | $2,134 |
| Williams | 19 | 2,039.84 | $3,931,927 | $1,928 |
| Dunn | 3 | 239.6 | $193,423 | $807 |
| Billings | 14 | 1,600 | $215,280 | $135 |
| All counties | 52 | 5,418.44 | $9,931,866 | $1,833 |
The Land Board's table prints $1,098 an acre for Williams County, but its own bonus and acres for that county ($3,931,927 over 2,039.84 net acres) work out to $1,928, so we show $1,928.
| County | State | Parcels | Gross acres | High bid per acre |
|---|---|---|---|---|
| McKenzie | ND | 13 | 2,589.95 | $6,963 |
| Divide | ND | 3 | 552.5 | $5,657 |
| Williams | ND | 2 | 45.08 | $1,805 |
| Musselshell | MT | 1 | 160 | $10 |
| Renville | ND | 1 | 40 | $10 |
BLM's results sheet does not list counties, so we took each parcel's county from BLM's parcel list and weighted by parcel acres. The sale results page has the full history at lease sale results.
The Oct. 27, 2026 BLM sale, parcel by parcel
What it shows. Where the parcels in BLM's Oct. 27, 2026 sale are, colored by the high bid per acre. McKenzie County had 13 of the 20 parcels and about 2,589.95 acres. Every parcel drew a bid.
How to read it. BLM lists each parcel by township, range and section. We placed each one at the middle of its section, or of its sections where it spans more than one, using BLM's public land survey outlines, and checked that each lands in the county BLM lists. A parcel can be only part of a section, so the circle shows roughly where it is, not its exact boundary. 1 parcel is not on the map: Musselshell County, T. 11 N., Sec. 22, outside the map area (Montana).
The close-up covers township 149 north, range 104 west, where 9 of the sale's 20 parcels sit. A section is a square mile, and a township is a six-by-six block of them. Where a section holds more than one parcel, the shade is the acre-weighted average and the label says how many.
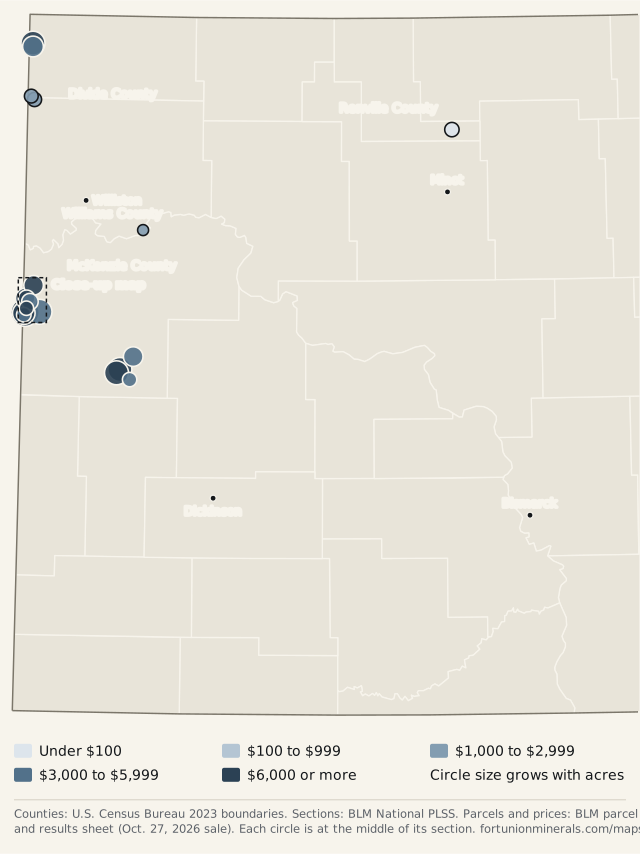
| County | Legal description | Acres | High bid per acre | Map |
|---|---|---|---|---|
| Divide | T. 160 N., R. 103 W., Fifth Principal, Sec. 32 LOTS 5-7 | 32.5 | $2,589 | On the map |
| Divide | T. 162 N., R. 103 W., Fifth Principal, Sec. 11 N2 | 320 | $6,032 | On the map |
| Divide | T. 162 N., R. 103 W., Fifth Principal, Sec. 14 NENW, S2NW, N2SW | 200 | $5,556 | On the map |
| McKenzie | T. 145 N., R. 99 W., Fifth Principal, Sec. 6 NWSE | 40 | $3,102 | On the map |
| McKenzie | T. 146 N., R. 100 W., Fifth Principal, Sec. 22 S2 | 320 | $8,156 | On the map |
| McKenzie | T. 146 N., R. 100 W., Fifth Principal, Sec. 28 N2 (EXCL 1 AC) | 319 | $11,000 | On the map |
| McKenzie | T. 147 N., R. 99 W., Fifth Principal, Sec. 32 SW | 160 | $4,001 | On the map |
| McKenzie | T. 149 N., R. 104 W., Fifth Principal, Sec. 20 SWSW | 40 | $6,023 | On the map |
| McKenzie | T. 149 N., R. 104 W., Fifth Principal, Sec. 25 N2NW, SW, NWSE, S2SE | 360 | $4,011 | On the map |
| McKenzie | T. 149 N., R. 104 W., Fifth Principal, Sec. 29 W2NW, SW, SESE; Sec. 30 LOTS 1,2; Sec. 30 E2NE, E2SE; Sec. 31 NESE, LYING NORTH AND WEST OF HWY 68 (FKA HWY 61) | 521.57 | $7,012 | On the map |
| McKenzie | T. 149 N., R. 104 W., Fifth Principal, Sec. 30 LOTS 3,4; Sec. 31 LOT 3, LYING NORTH AND WEST OF HWY 68 (FKA HWY 61); Sec. 31 LOT 4, LYING NORTH AND WEST OF HWY 68 (FKA HWY 61); Sec. 31 SENE, LYING NORTH AND WEST OF HWY 68 (FKA HWY 61); Sec. 31 LOTS 1,2; Sec. 31 NENE | 265.26 | $9,211 | On the map |
| McKenzie | T. 149 N., R. 104 W., Fifth Principal, Sec. 31 LOT 3, THAT PORTION LYING SOUTH AND EAST OF HWY 68 (FKA HWY 61); Sec. 31 SENE, THAT PORTION LYING SOUTH AND EAST OF HWY 68 (FKA HWY 61); Sec. 31 LOT 4, THAT PORTION LYING SOUTH AND EAST OF HWY 68 (FKA HWY 61) | 43.9 | $5,451 | On the map |
| McKenzie | T. 149 N., R. 104 W., Fifth Principal, Sec. 5 LOT 1; Sec. 5 SESE | 80.09 | $6,055 | On the map |
| McKenzie | T. 149 N., R. 104 W., Fifth Principal, Sec. 5 LOT 3; Sec. 5 S2SW, SWSE; Sec. 6 SESE | 200.13 | $6,066 | On the map |
| McKenzie | T. 149 N., R. 104 W., Fifth Principal, Sec. 9 E2NE | 80 | $5,749 | On the map |
| McKenzie | T. 150 N., R. 104 W., Fifth Principal, Sec. 15 S2SW, S2SE | 160 | $6,037 | On the map |
| Musselshell | T. 11 N., R. 28 E., Montana Principal, Sec. 22 N2NE, N2NW | 160 | $10 | Outside the map area (Montana) |
| Renville | T. 158 N., R. 82 W., Fifth Principal, Sec. 15 NWNE | 40 | $10 | On the map |
| Williams | T. 153 N., R. 98 W., Fifth Principal, Sec. 22 LOT 6 | 5.4 | $2,007 | On the map |
| Williams | T. 159 N., R. 103 W., Fifth Principal, Sec. 4 PORTION OF LOT 5 WITHIN THE LINEAR CONFINES OF SEC. 4; Sec. 4 LOT 2 | 39.68 | $1,778 | On the map |
Active drilling rigs by county
What it shows. How many drilling rigs were running in each North Dakota county. The count is a snapshot, so it moves from day to day.
How to read it. The North Dakota Department of Mineral Resources lists every active rig with its county. We counted that list by county on October 27, 2026 at about 10:10 PM Pacific. The list doesn't carry its own date, so the date here is the day we read it. DMR's list matches the 38 rigs in our Oct. 27, 2026 summary of the daily activity report. We keep only the county totals.
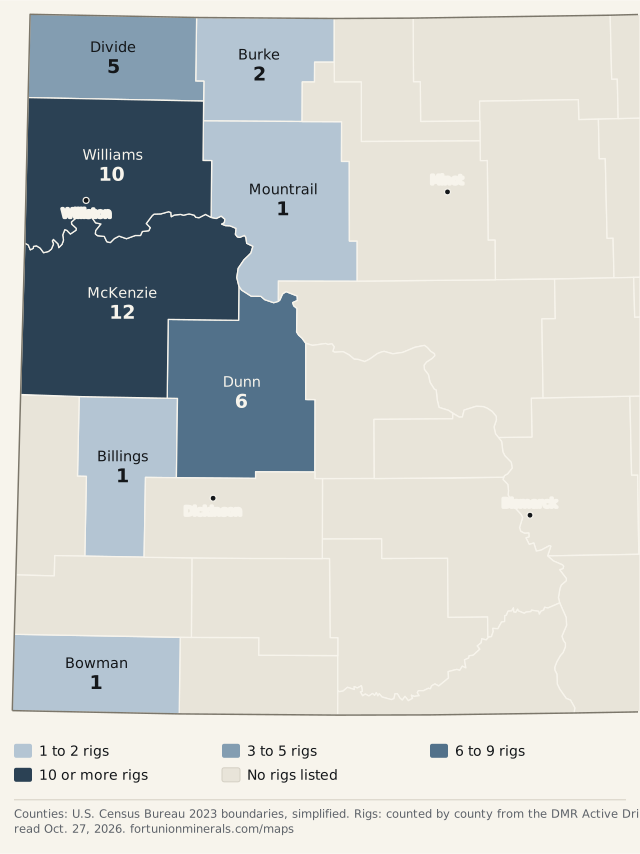
| County | Rigs |
|---|---|
| McKenzie | 12 |
| Williams | 10 |
| Dunn | 6 |
| Divide | 5 |
| Burke | 2 |
| Billings | 1 |
| Bowman | 1 |
| Mountrail | 1 |
| North Dakota total | 38 |
How we make these maps
Each map is drawn from public data when we build the site. The images and tables are the plain version. The interactive map at the top is the same data in a viewer that runs from our own files, so nothing loads from another site, and there are no trackers or tile services. The county outlines are simplified to keep the files small, so the edges are close but not survey-grade. Dollar figures marked as our tally are our own arithmetic on the official figures. If a number here looks wrong, tell us at offers@fortunionminerals.com and we will check it against the source.
We add new maps as we can verify the data behind them. The results pages and the daily reports explain how we read the official documents: see our editorial standards.
Sources
- U.S. Census Bureau, cartographic boundary files (2023 counties, 1:5,000,000)
- U.S. Census Bureau, Gazetteer files (place points)
- BLM National PLSS CadNSDI (section outlines)
- North Dakota DMR Oil and Gas Division, Active Drilling Rig List
- Board of University and School Lands agenda packet, October 29, 2026 (October 2026 auction results summary)
- BLM ePlanning documents page for the sale (Sale Results)
Related: lease sale results, lease sales calendar, NDIC daily report summaries and the Bakken counties page.
This page is general information, not legal, tax or financial advice. It does not value your minerals. Fort Union buys minerals and royalty interests, so we have a commercial interest in this subject. Nothing here depends on selling to us. If you would like to know what we would pay for your interest, the offer page is the way to ask.